A page you open every morning.
Say what a dashboard should answer and Confluxly builds it from the data it already holds. Overnight it redraws from the day's figures with no AI in the loop, so what you see at nine is this morning's numbers.
Live in early access, shared within your workspace.
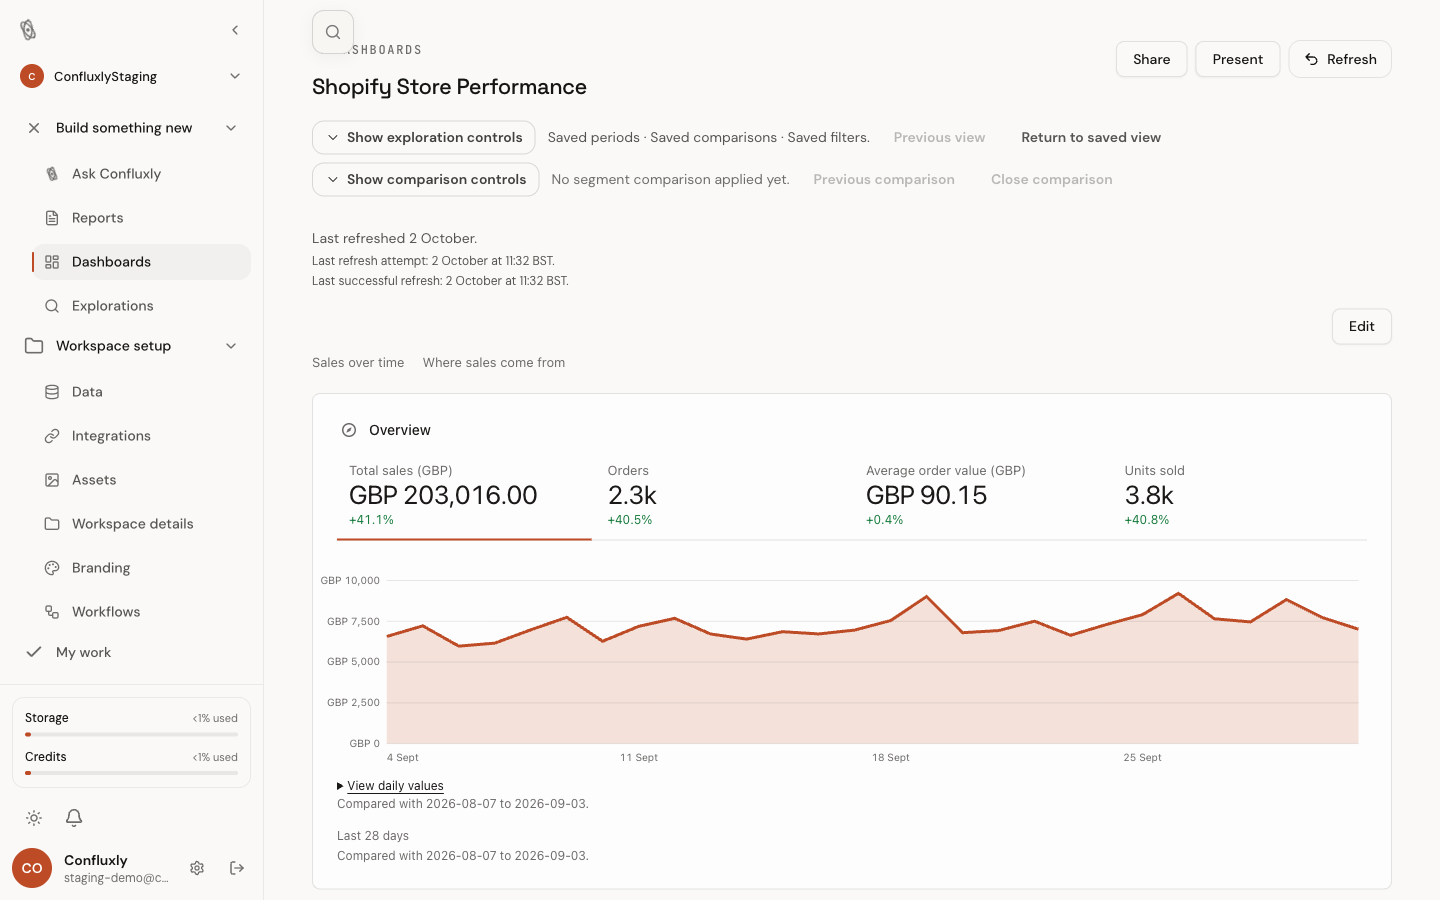
Built from a question.
A dashboard starts as a sentence: how are our channels performing this month. The model chooses from a library of layouts and a library of held metrics, and both are fixed lists, so it cannot invent a layout and it cannot invent a number. Tiles the store cannot answer are dropped and you are told which.
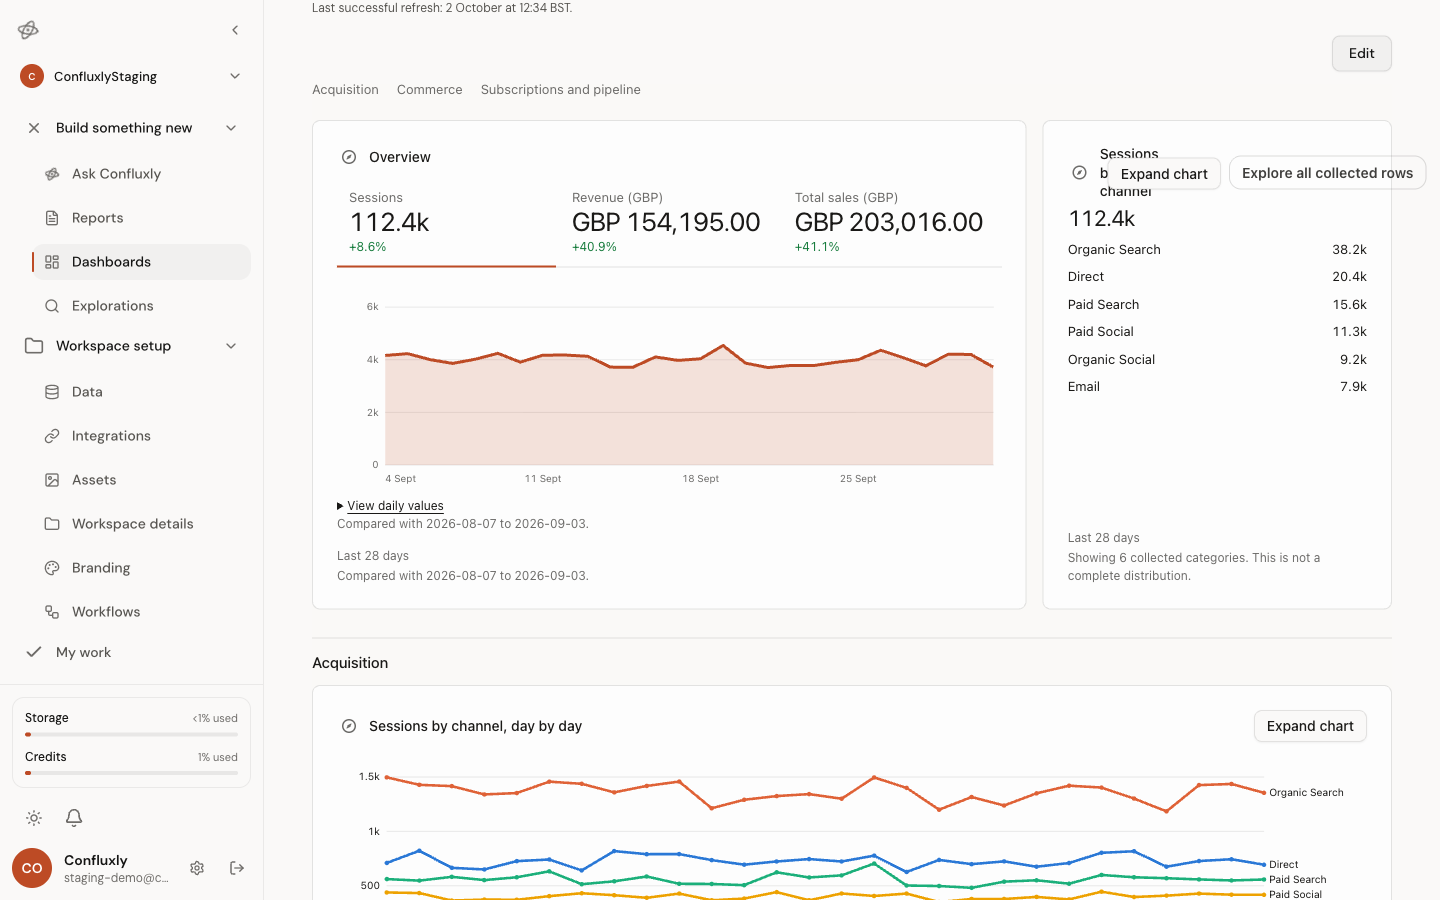
Each night it redraws itself.
Once a dashboard exists, keeping it current costs no AI. Every night after your sources sync, the same plan is redrawn from the fresh figures. It is quick and cheap, and the layout stays the same as yesterday's.
- Last successful refresh, last attempt and last edit are tracked separately.
- A tile whose figure went missing says so rather than showing a zero.
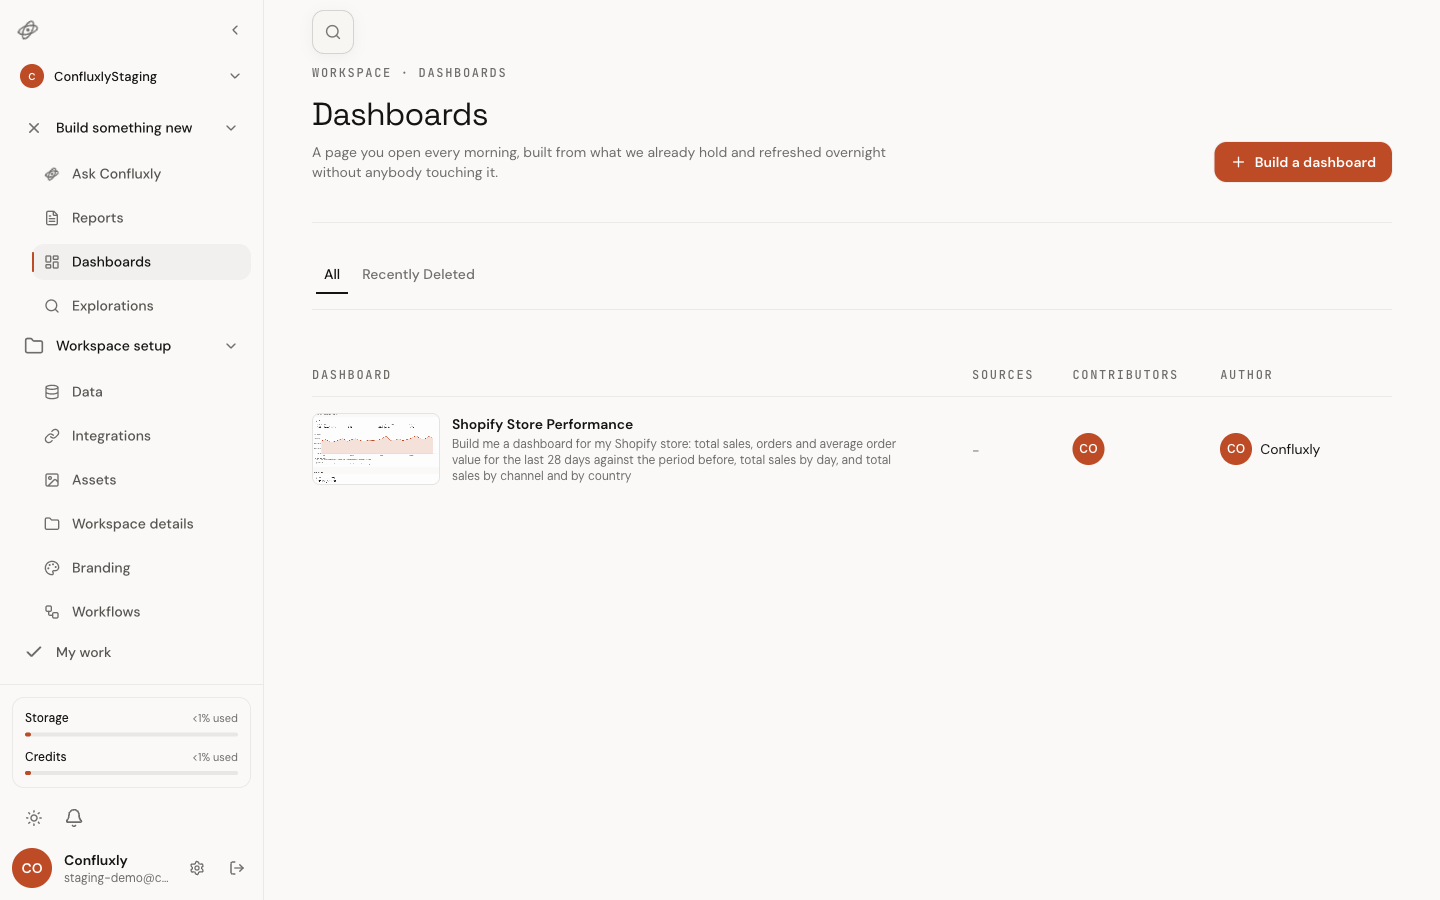
- Deleted dashboards sit in a trash you can restore from.
Change it by asking.
Ask for the revenue tile to be the biggest thing on the page, or for the second row to become conversion rate by channel, and the dashboard changes and tells you what it changed. Or swap the source behind one card without touching the rest. There is nothing to drag or resize, and no settings panel.
Go deeper without leaving the page.
Period, comparison and breakdown controls sit on every chart. Expand a chart into its exact daily values, open the full table, drill from a figure to the rows behind it, and export a table as CSV. Save a private view of your own filters, and leave notes only you can see.
Every tile knows where it came from.
Under each tile is the list of fetches that produced it, and each fetch keeps the raw response the provider sent. You can get from any number on a dashboard to the raw response behind it in three clicks.
What it does not do yet.
Written down so you do not have to ask. When one of these changes, the changelog says so.
Read the changelog- Dashboards are shared with your workspace only. There is no public or read-only link yet, and no viewer role.
- There is no drag-and-drop editing, by design. Changes are a conversation or a source swap.
- Funnels, cohorts and user-level analysis are not available as tiles.
- Google Analytics 4, Search Console, HubSpot, Mailchimp and Stripe are live today. Other sources are in progress.
Questions people ask about this.
The same store, other outputs.
- AskAsk a question and see the figures behind the answer.
- DecksBuild slides by chatting, then export to PowerPoint.
- The storeFourteen months of your figures, kept in one place.
See it on your own numbers.
Get early access and we will build the first draft from one of your own sources.
Get early access