Ask it what happened.
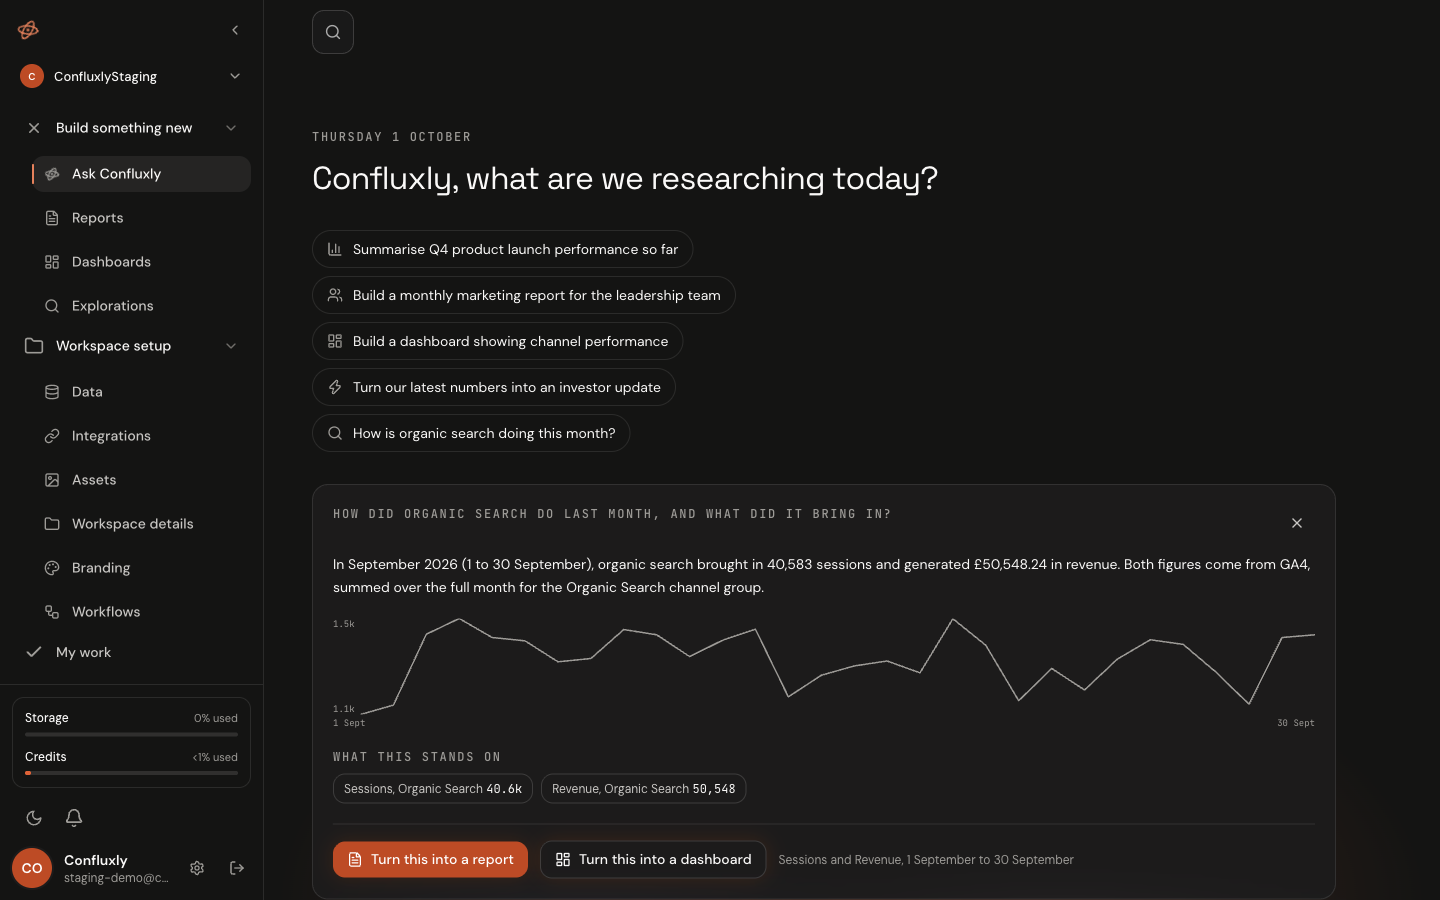
Type a question in plain language. The answer comes back with every figure it used, cited to the source, and a chart when one helps. If you like it, one click makes it a dashboard or a deck.
Live in early access. Answers read from the store, so they cover whatever your connected sources hold.
Organic search brought 54,210 sessions in September, up 18% on August. It produced 1,204 key events and 312 new paying customers, the most of any channel. Growth came from landing pages published in the last six weeks.
Organic sessions, September
Daily · GA4
Every figure cited and checked.
The model can only choose from figures already held in the store, which plain code pulled from your sources. Before you see an answer, every number in it is checked against those figures. A number the tools did not supply fails the whole answer rather than slipping through.
- Figures appear as chips naming the source and the metric.
- Follow any chip back to the exact request and response that produced it.
- If a question cannot be answered from held data, it says so, and says why.
Questions that cross sources.
Because the figures are kept together, a question can put traffic beside revenue or pipeline beside spend. No single provider does that join for you.
- Google Analytics 4, Search Console, HubSpot, Mailchimp and Stripe are live today; the rest are in progress.
- Each source adds its metrics and dimensions to what Ask can reach.
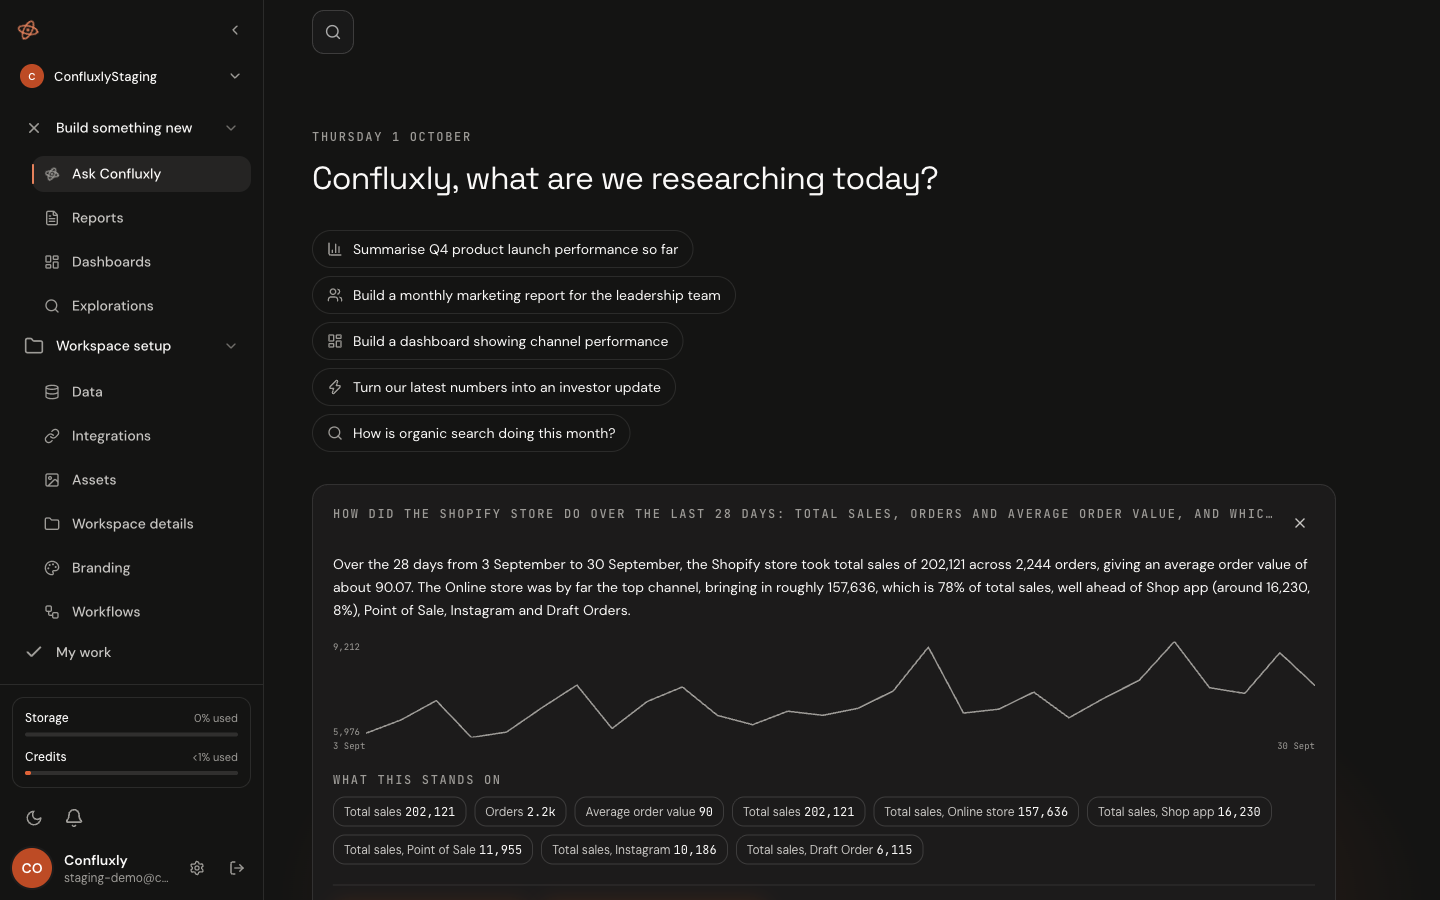
If it isn't held yet, it gets fetched.
If the store does not hold a figure and the source can supply it, Confluxly fetches it first and then answers. If the source cannot supply it, because the account did not exist then or the scope was never granted, the answer says that plainly instead of showing a zero.
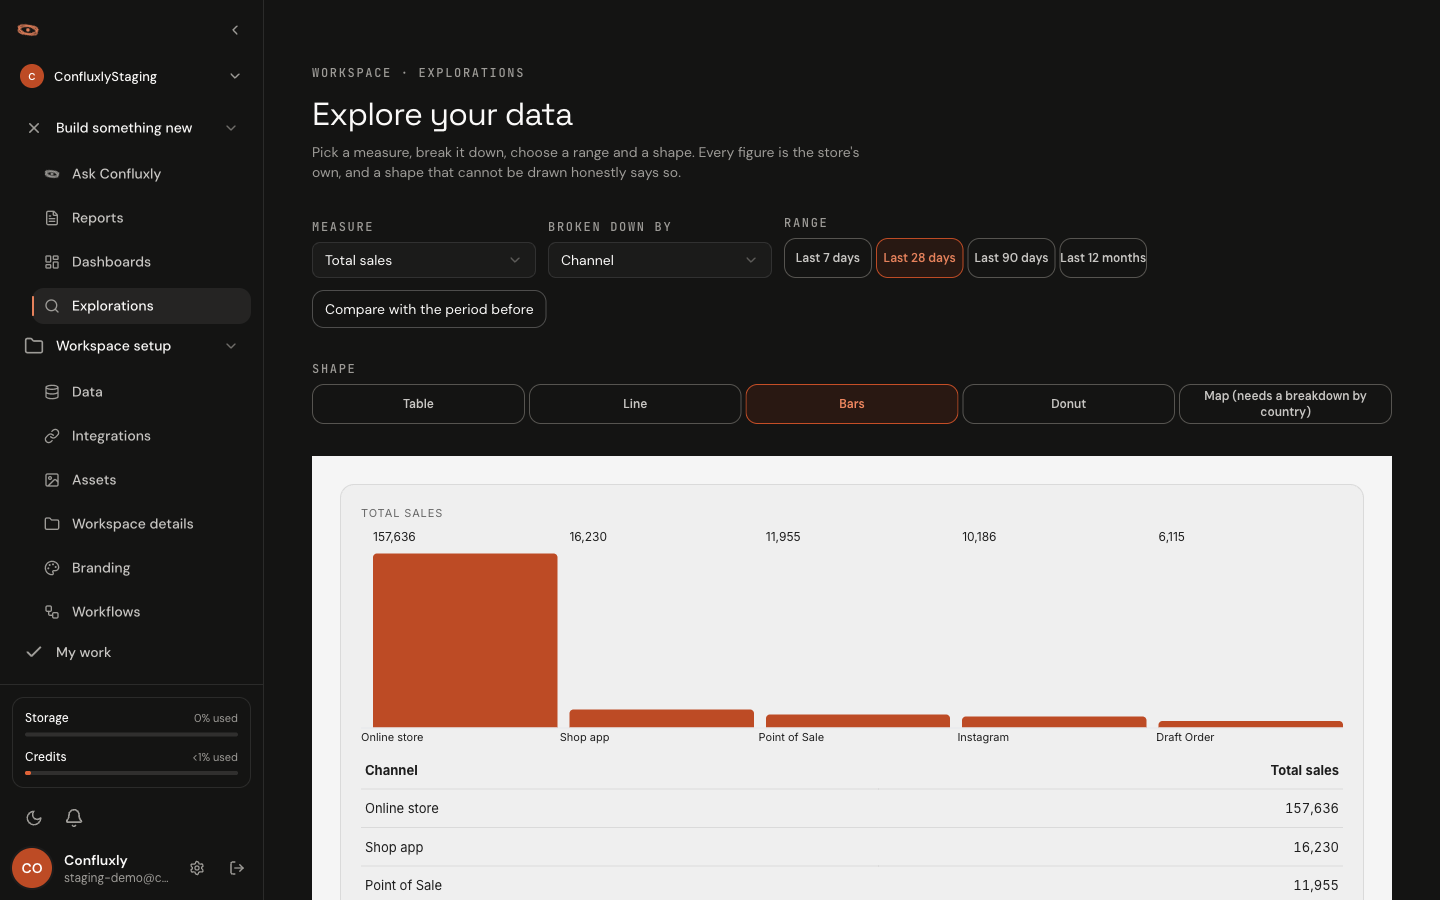
Explorations, for when you want the table.
Pick a measure, split it by any dimension the source offers, and compare two periods. The arithmetic is done by code, never by the model, so a rate is weighted properly and a unique count is never added twice.
Then the rest of your stack.
The plan is to add the tools that hold the rest of the day, such as the inbox, the calendar and the support desk, with you choosing what it may read. Today Confluxly reads figures only.
What it does not do yet.
Written down so you do not have to ask. When one of these changes, the changelog says so.
Read the changelog- It cannot tell you why a number changed. Causal insight, anomaly alerts and a daily digest are planned, not built.
- It reads figures only. Documents, inboxes and calendars are not connected, and the sensitivity levels for them are a plan.
- Google Analytics 4, Search Console, HubSpot, Mailchimp and Stripe are live today. Other sources are in progress and marked as such on the sources page.
- Answers are shared with your workspace, not with a public link.
Questions people ask about this.
The same store, other outputs.
- DashboardsLive pages that update every night with the latest figures.
- DecksBuild slides by chatting, then export to PowerPoint.
- The storeFourteen months of your figures, kept in one place.
See it on your own numbers.
Get early access and we will build the first draft from one of your own sources.
Get early access